Announcing metrics.opensuse.org
metrics.opensuse.org has been available for a few weeks, but now has an accompanying video presentation to help make sense of the information. The goal of the effort was to provide insight into the staging process used to build both openSUSE and SLE releases and the impact of tooling changes on the process. The implementation is comprised of three parts:
- python script for ingesting and processing request histories
- InfluxDB to which data is written
- Grafana for presenting data
The end result can be seen below.
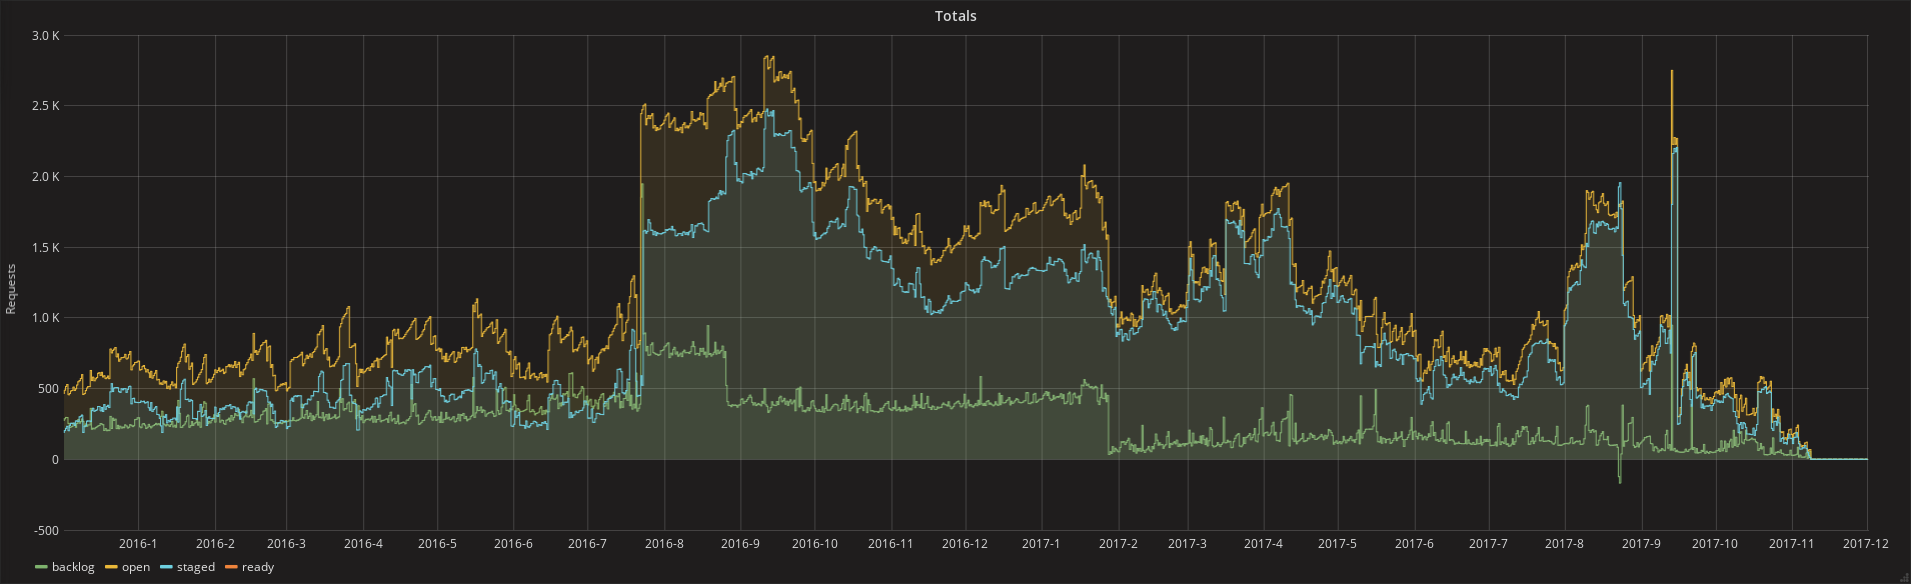
For those familiar with the staging process the graphs will likely make some sense, but for those without a firm understanding of the process a bit of explanation is required. A video explanation of the various graphs and details behind the data can be seen below.
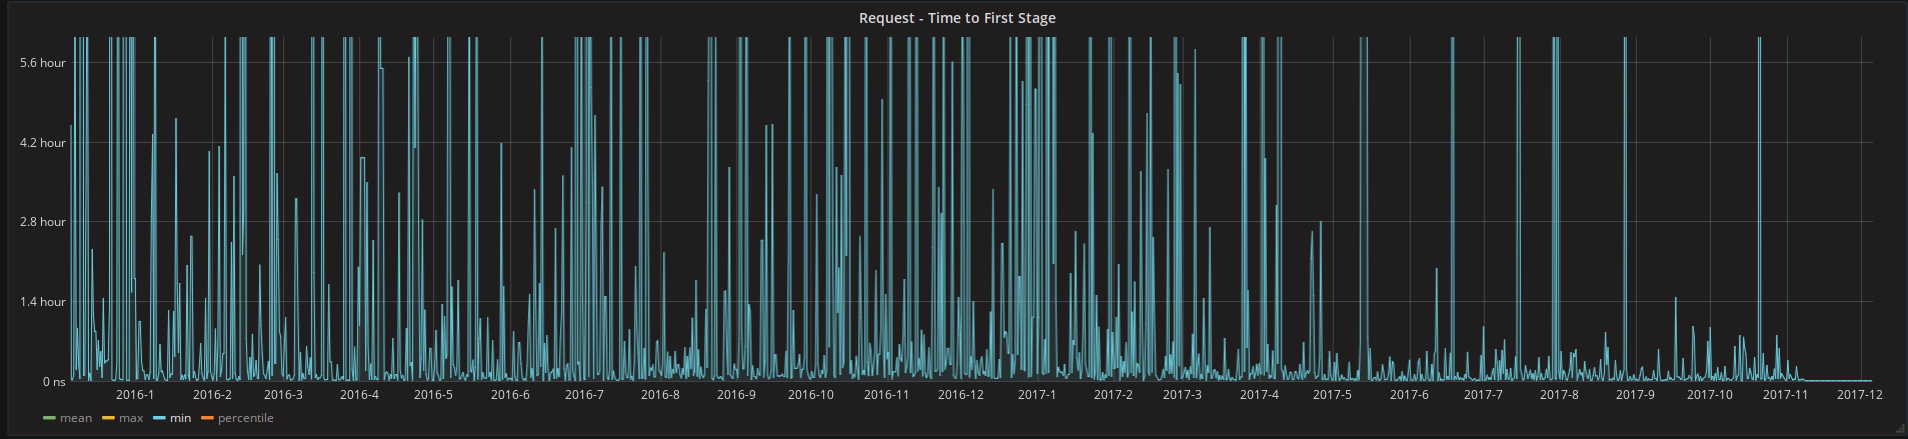
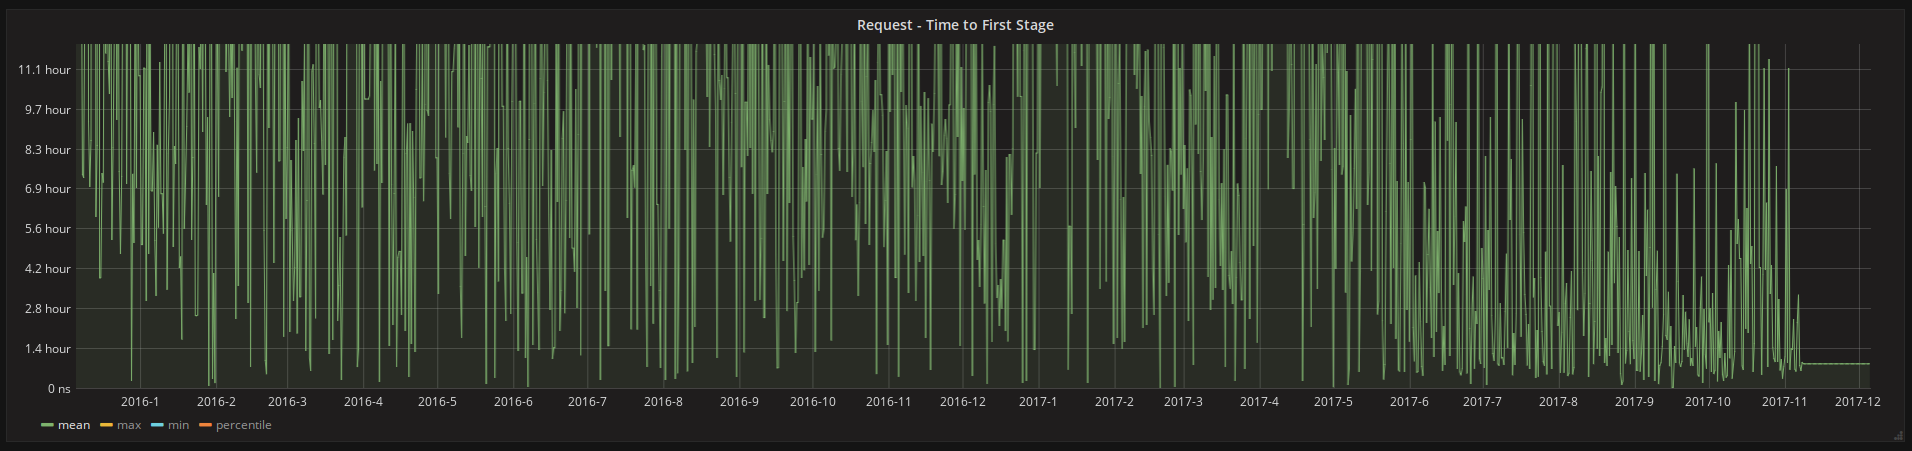
One important bit missing from the video is a zoomed in view of the time to first stage which clearly shows a drop in both the mean and min time after 2017-5 when the staging-bot was enabled.
The annoucement thread on the opensuse-factory mailing list can be used for discussion.